Journalism in figures:
2024

The following pages and the chapter about ADR contain figures on each brand and, if available, information on their evolution over recent years. This data could be seen as ‘health indicators’ for journalism, with the caveat that good-quality journalism is about more than just editor headcounts or the number of paid subscribers.
Journalism in figures: 2024
National news media: the figures
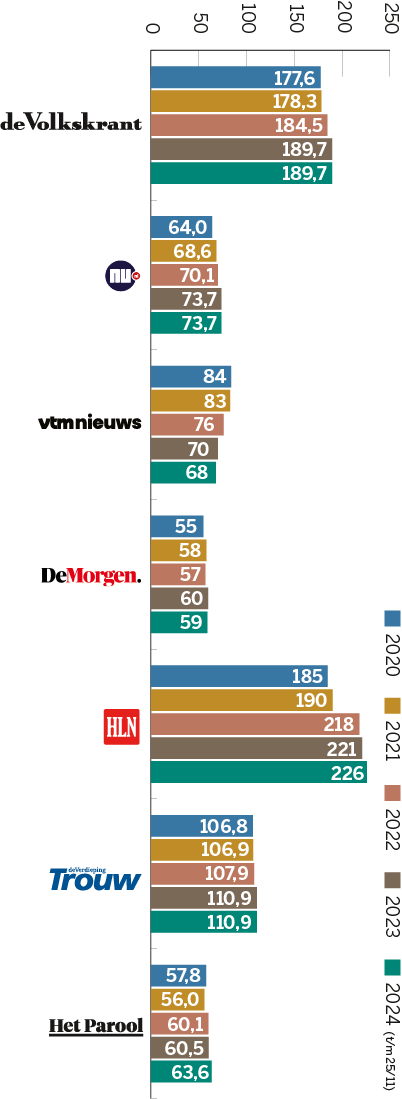
Average daily reach
Daily reach is a commonly used indicator of the impact of digital journalism. Monthly reach is also shown in the national media monitors, but is influenced to a relatively large degree by one-time site visitors.
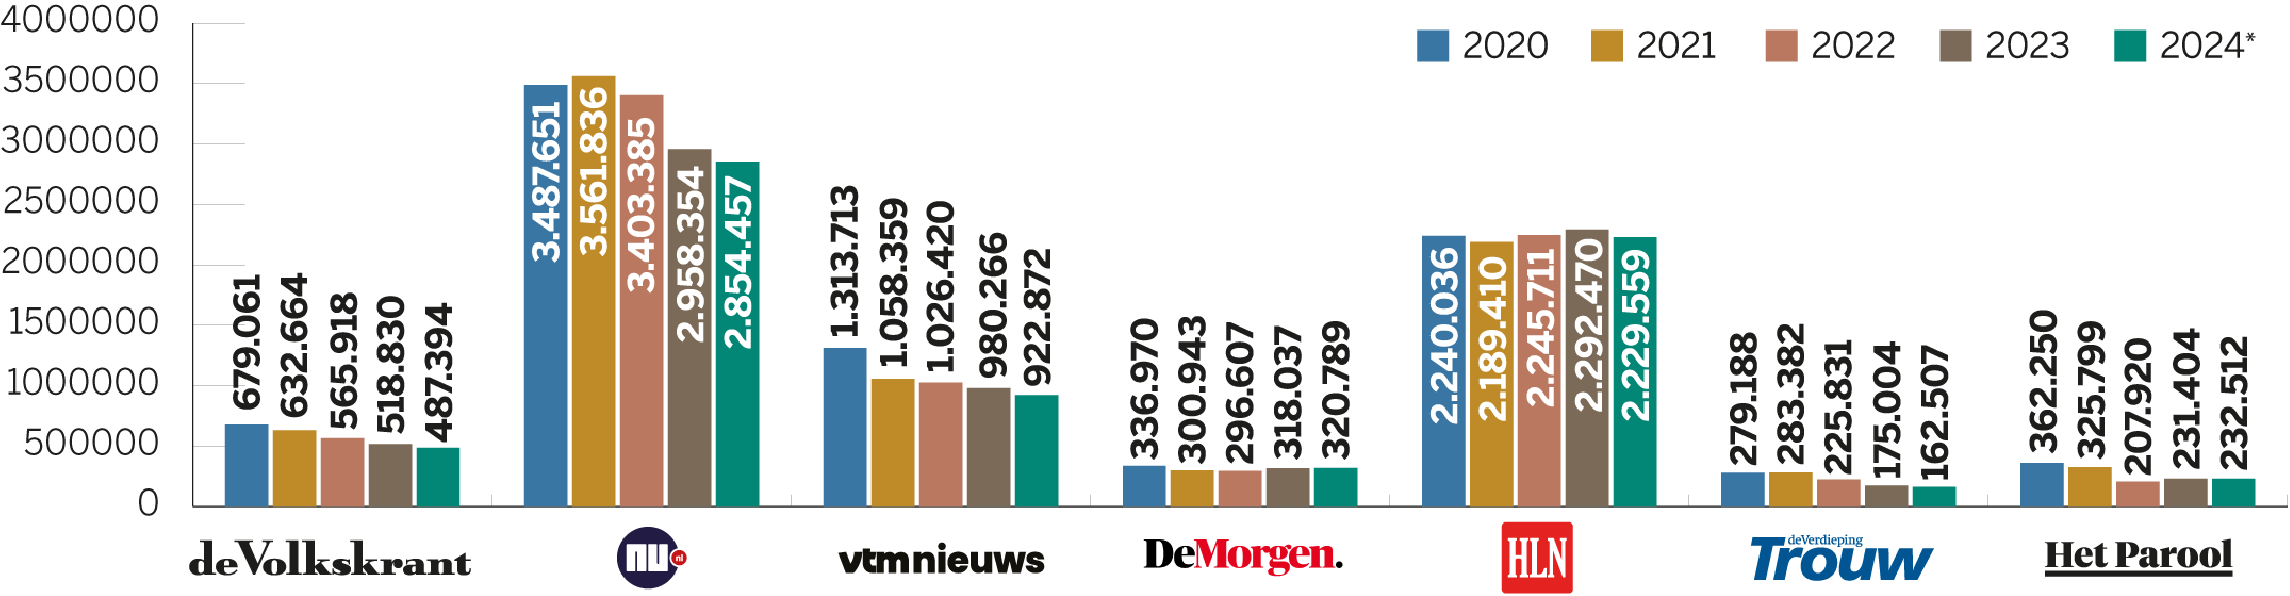
More info
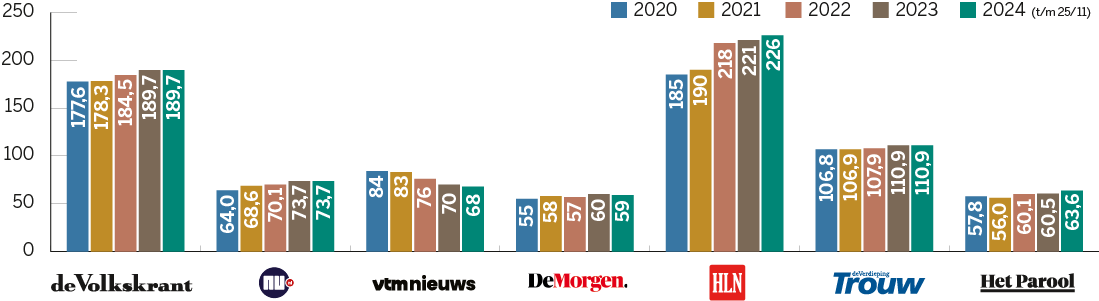
Journalists on permanent contracts in 2024
This shows the size of editorial teams, converted into full-time equivalents (FTEs). Editorial teams include reporters, editors-in-chief, copy editors, designers, image editors, video and podcast creators and online editors. To avoid skewing the numbers, freelance journalists are not included. This does not reflect on their equally valuable contribution in the form of articles, columns, images and audiovisual input. A brand may employ hundreds of freelancers, whose numbers and assignments vary from year to year.
More info
Average number of unique articles per day
This is the amount of original articles produced by each editorial team, from large to small. Most editorial teams publish more than this: for example, articles from the central editorial team in the case of regional newspapers, or (in Belgium) articles from other brands that are republished. These are not included, nor are small local reports that are automatically generated (such as weather and emergency reports), or republished articles from ‘Indebuurt’. This results in a pure figure of what the editorial team itself produces daily.
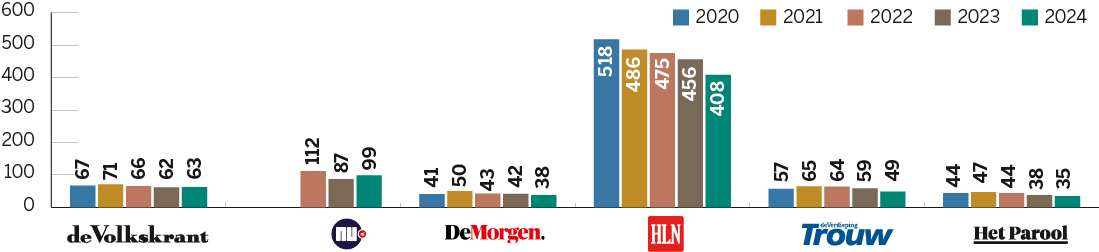
More info
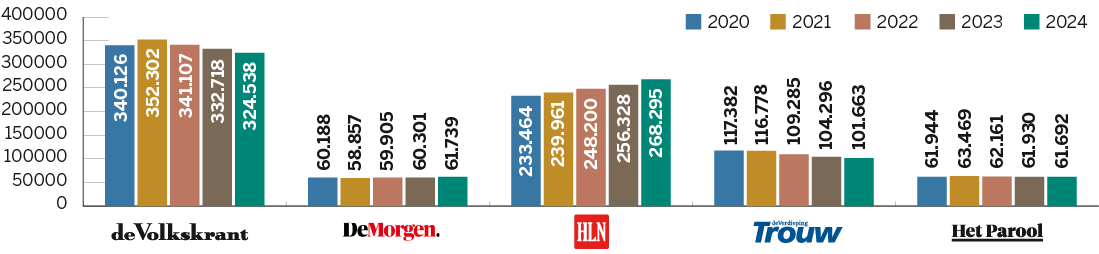
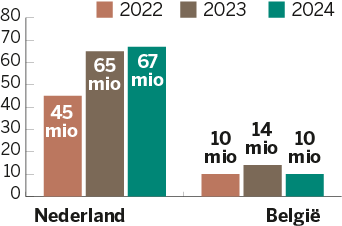
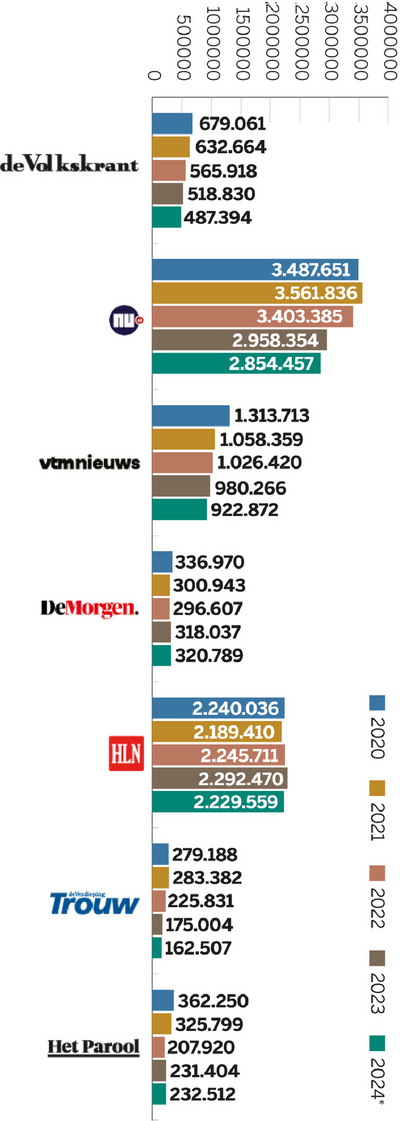
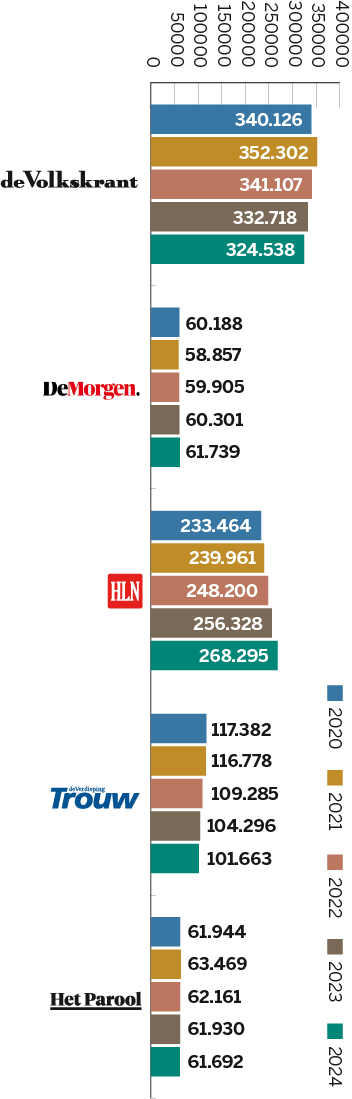
Paid subscribers
This is the sum of paper, digital and hybrid subscriptions, presenting the average number in the year in question.
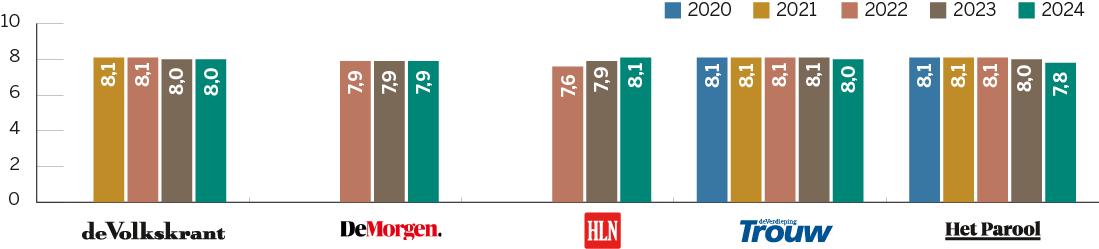
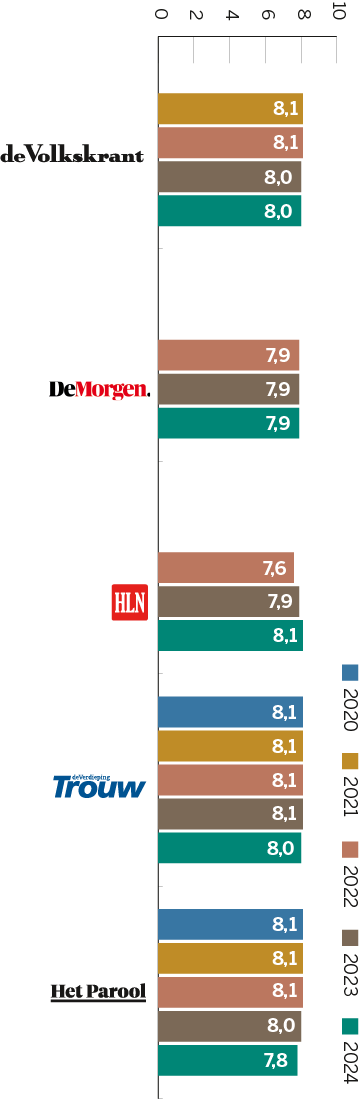
Ratings by brand subscribers
This rating is given by respondents in annual readers’ surveys conducted for most brands.
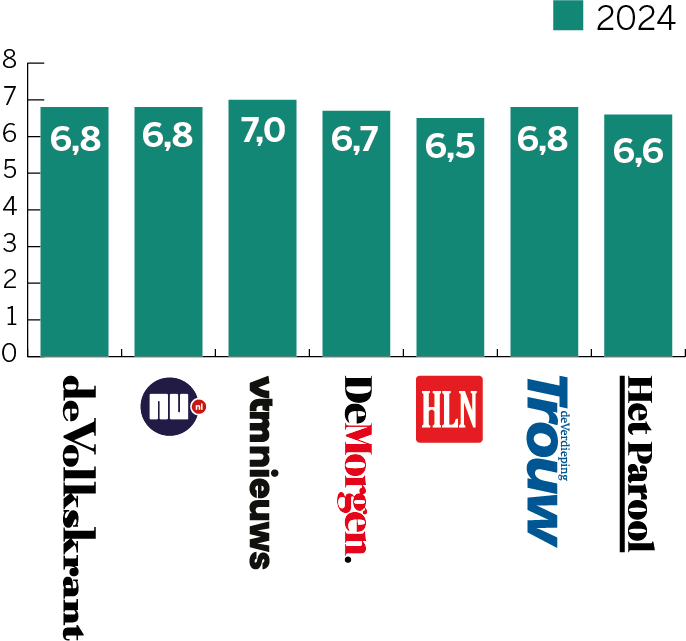
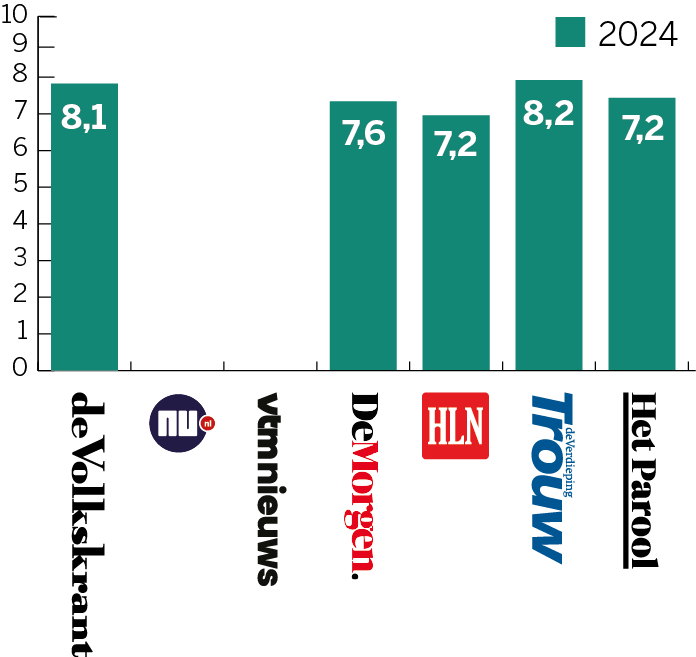
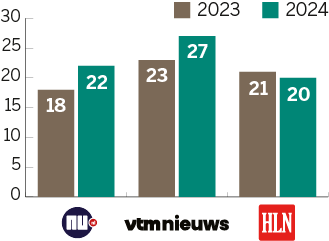
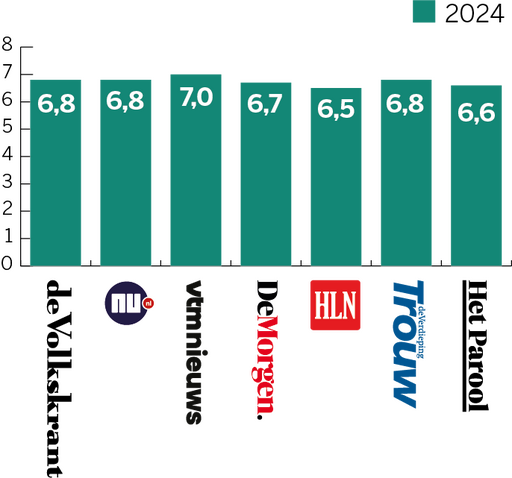
Trust rating according to survey
This figure is taken from a recent survey into brand trust commissioned by DPG Media. A general body of respondents – i.e. not only subscribers or visitors – are asked to rate their trust in various news media on a scale of 0 (no trust) to 10 (absolute trust). Subscribers, who tend to give their chosen brand an above-average trust rating, are placed in a separate group. This research method and the outcomes correspond to those of the annual Digital News Report by the Reuters Institute in Oxford. According to the Report, the average trust ratings in the Netherlands and Flanders are higher than the trust ratings in neighbouring European countries.
General body of respondents
Subscribers
Number of podcast episodes per year for all brands
These figures indicate how many podcasts have been developed by the various brands.
Average number of unique videos per day
These figures indicate how many videos have been developed by the various brands.
Journalists on permanent contracts
Journalists on permanent contracts in 2024
This shows the size of editorial teams, converted into full-time equivalents (FTEs). Editorial teams include reporters, editors-in-chief, copy editors, designers, image editors, video and podcast creators and online editors. To avoid skewing the numbers, freelance journalists are not included. This does not reflect on their equally valuable contribution in the form of articles, columns, images and audiovisual input. A brand may employ hundreds of freelancers, whose numbers and assignments vary from year to year.
Meer info
Unique articles per day
Average daily reach
Average daily reach
Daily reach is a commonly used indicator of the impact of digital journalism. Monthly reach is also shown in the national media monitors, but is influenced to a relatively large degree by one-time site visitors.
Meer info
Paid subscribers
Paid subscribers
This is the sum of paper, digital and hybrid subscriptions, presenting the average number in the year in question.
Ratings by brand subscribers
Ratings by brand subscribers
This rating is given by respondents in annual readers’ surveys conducted for most brands.
Trust rating according to survey
Trust rating according to survey
This figure is taken from a recent survey into brand trust commissioned by DPG Media. The research method used corresponds to that of the annual Digital News Report by the Reuters Institute in Oxford. The larger DPG Media brands are also measured in this report. Trust ratings of 6 to 7 are relatively high compared to news media in most other countries.
General body of respondents
Subscribers
